FX Strength Pulse
A read-only cTrader desktop plugin that turns 28 FX pairs into a live currency-strength ranking with the top signal pairs to watch. FREE ships a single-timeframe ranking + strength alerts; PRO adds up to 4 timeframes in parallel, a 28-pair heatmap, an impulse tracker, ranking-cross alerts and full alert history. No trades, no advice, no account changes: it only reads bars and renders numbers.
See it on the chart
Why it adds value
Most "currency strength" tools on cTrader print a single number per currency and stop there. FX Strength Pulse goes further: it ranks the 8 majors from strongest to weakest on your timeframe, surfaces the pairs with the widest gap and — on PRO — shows you whether that setup is consistent across multiple timeframes or just a one-bar artefact. All inside a cTrader-native panel that disappears from the chart the moment you stop using it.
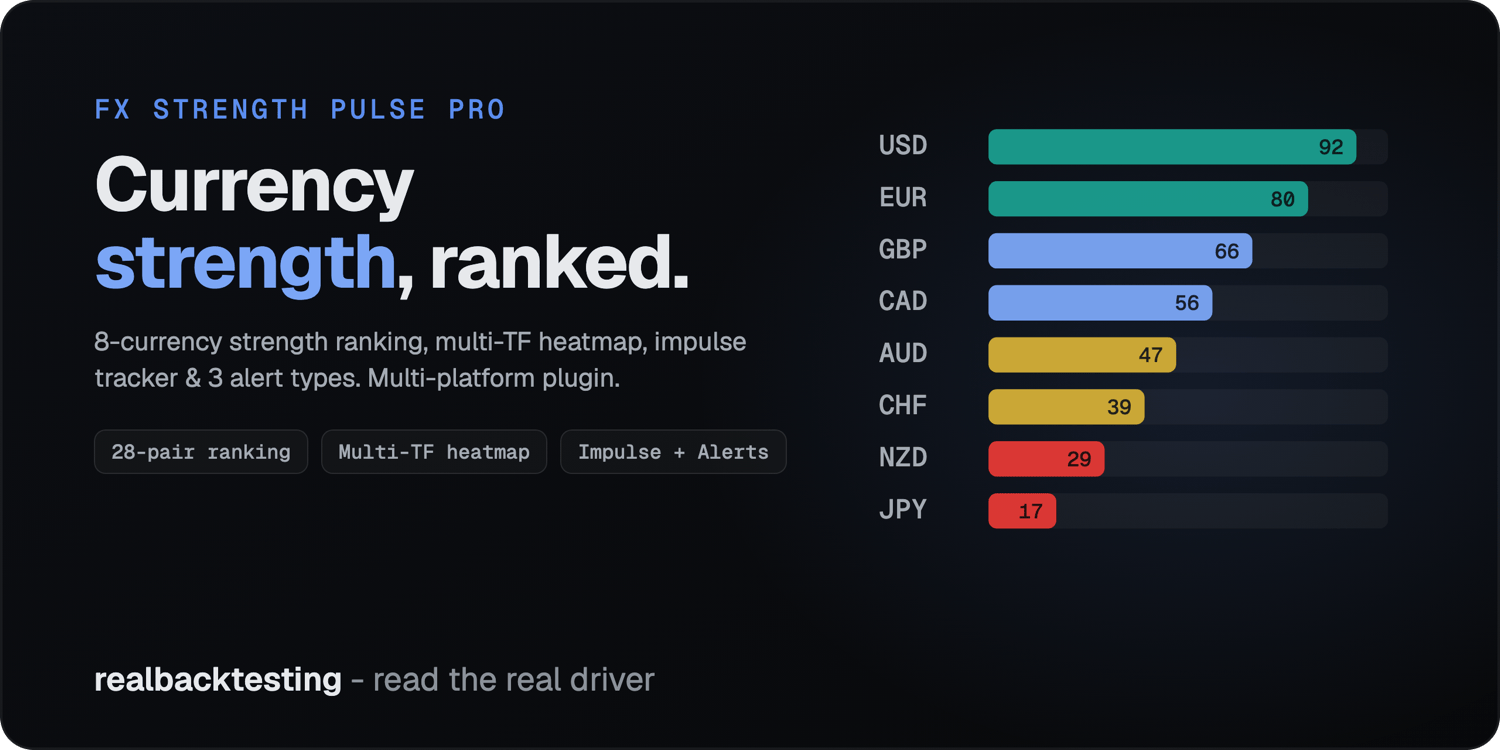
One-glance ranking
Eight bars (AUD · CAD · CHF · EUR · GBP · JPY · NZD · USD) coloured by relative strength. Above 70 = clearly strong, below 30 = clearly weak. No reading numbers row by row. FREE PRO
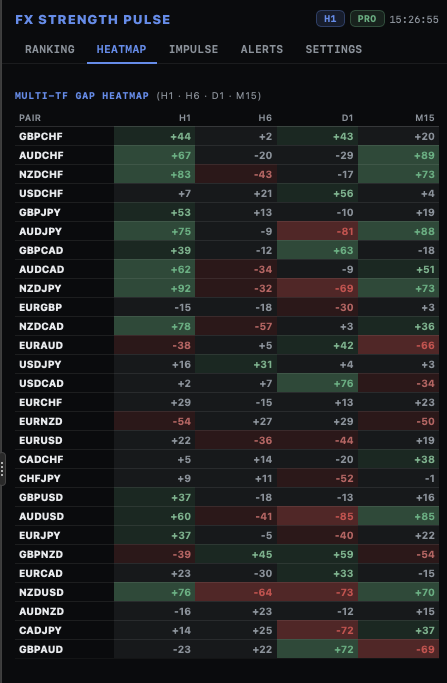
Multi-TF heatmap PRO
28 pairs × up to 4 timeframes, colour-coded by gap magnitude. Dark green = both currencies agree on direction, dark red = strong disagreement. One glance answers "is this setup clean across timeframes, or just on one?".
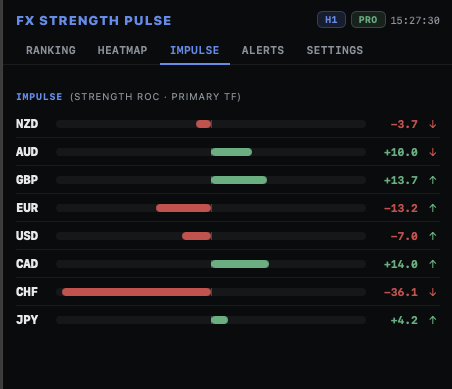
Impulse tracker PRO
ROC of strength (impulse) + ROC of impulse (acceleration). A currency at strength 80 rising fast tells a different story than a currency at strength 80 flattening. PRO shows the histogram for each.
Three alert types PRO
Overbought/Oversold (rising edge) FREE, ranking-cross (two currencies swap position) PRO, impulse surge (|ROC| over threshold) PRO. All deduplicated. PRO keeps the last 100, FREE shows the last 3.
Video — install + read the dashboard
 FX Strength Pulse — install, ranking, heatmap, alerts
Opens on YouTube (channel @realbacktesting). Local poster pending — David pastes the exact URL in .fvideo href once the recording lands.
Free vs PRO — clear differences
FREE is a complete, useful tool on its own (not a trial). PRO adds the multi-timeframe view, the impulse tracker, two more alert types and full alert history. Same engine, same code path, same plugin architecture.
| Capability | FREE | PRO |
|---|---|---|
| Dashboard | ||
| Chip-up tab in cTrader (Asp.AddTab) — always one click away | Yes | Yes |
| Currency ranking of 8 majors | Yes | Yes |
| Timeframes simultaneous | 1 (configurable) | up to 4 simultaneously |
| Top signal pairs (gap × confluence) | top 5 | top 3–20 (configurable) |
| Per-TF gap columns in signal table | — | Yes |
| Cross-TF confluence % | — | Yes |
| Multi-TF heatmap (28 pairs × N timeframes) | — | Yes |
| Impulse tracker (ROC of strength + acceleration) | — | Yes |
| Settings tab in dashboard | — | Yes |
| Alerts | ||
| Overbought / Oversold (rising-edge, deduplicated) | Yes | Yes |
| Ranking-cross (two currencies swap position) | — | Yes |
| Impulse surge (|ROC| over threshold) | — | Yes |
| Alert history (in-panel) | last 3 (collapsed) | last 100, filterable (All / Strength / Rank / Impulse) |
| Delivery channels | Popup + Sound | Popup + Sound + Email (via cTrader SMTP) |
| Pricing | ||
| Price | Free · permanent | $19/mo · or $99 lifetime (early) |
How the calculation works
No black box. Same engine for FREE and PRO; PRO just runs it on more timeframes in parallel and combines the results.
Step 1 · ATR-normalised returns per pair
For each of the 7 pairs where a currency participates (e.g. for EUR: EURUSD, EURGBP, EURJPY, EURAUD, EURCAD, EURCHF, EURNZD), take the log-style return over Period bars and divide by the ATR(14) of that pair at the same bar: ret = (close[t] − close[t − Period]) / close[t − Period] / ATR[t]. If the currency is the quote in the pair, the sign is flipped. Dividing by ATR neutralises the fact that GBPJPY moves more than EURUSD per bar — without this step, GBPJPY would dominate the ranking.
Step 2 · Raw strength score per currency
Average the 7 (or fewer, if some pairs are missing on the broker) normalised returns. At least 2 valid pairs are required for a currency to score — otherwise it returns NaN and is excluded from the ranking. This is what prevents a single rogue broker quote from poisoning a currency.
Step 3 · Rolling min-max normalisation to [0..100]
For the chosen MinMaxWindow (default 150 bars), look back at the raw-score history of the same currency and map: minimum historical raw → 0, maximum → 100, current → in between. 70 EUR and 70 GBP mean the same thing: both are near their personal historical high. A flat market yields 50 for everyone; a trending market yields 0 for the weakest and 100 for the strongest.
Step 4 · Pair gap and confluence PRO scales this
A pair's gap is strength(base) − strength(quote). FREE: with 1 TF, confluence is 1.0 if |gap| ≥ MinGap else 0.0. PRO: confluence is the fraction of active timeframes (up to 4) where |gap| ≥ MinGap — so a pair at 4/4 alignment is qualitatively different from 1/4. Top pairs are sorted by |gap| × confluence on both editions.
Step 5 · Impulse and acceleration PRO
Impulse at bar t for a currency = strength[t] − strength[t − ImpulsePeriod]. Acceleration = impulse at t minus impulse at t − 1. Both are bounded to the 0..100 scale of the parent strength, so "EUR impulse +12" means EUR has gained 12 strength-units over the ImpulsePeriod bars. Only PRO renders this; FREE computes impulse implicitly but doesn't show a dedicated tab.
Step 6 · Alerts (rising-edge, deduplicated)
FREE fires one alert type: overbought/oversold rising-edge on each currency. PRO adds two more: ranking-cross (a currency swaps position with another in the ranking) and impulse surge (|ROC| above threshold). All three use the same rising-edge logic, so a currency that stays OVERBOUGHT for 10 bars fires one alert, not ten. The flag resets when the currency drops back inside the band, allowing a new alert to fire later.
Step 7 · Render to WebView
C# builds a JSON snapshot (currencies, pairs with per-TF gaps, heatmap array, impulse array, alerts array, settings snapshot) and pushes it via ExecuteScript("window.fxRender({…})"). The WebView's JS re-renders the active view without losing scroll position. Both editions use the same render pipeline.
How to read the numbers
A field guide. Items tagged PRO only apply to the PRO edition.
| What you see | Range | Meaning |
|---|---|---|
| Strength (ranking bar) | 0 – 100 | Where the currency sits in its own recent history. 50 = typical. ≥ 70 = near recent high. ≤ 30 = near recent low. NOT a forecast. |
| Bar colour | green / grey / orange / red | ≥ 70 strong green · 58–70 muted green · 42–58 neutral · 30–42 weak orange · < 30 weak red. Visual scan, not a signal. |
| Signal pair (LONG / SHORT) | gap × confluence | The base currency is stronger than the quote by at least MinGap. LONG = buy base / sell quote. Use your own entry logic — the tool just tells you which pairs have the cleanest setup. |
| Confluence % PRO | 0% – 100% | What fraction of active timeframes agree on the gap. On FREE there's only 1 TF, so confluence is either 0% (no signal) or 100% (gap ≥ MinGap). On PRO it can be anywhere from 0% to 100% across the 4 TFs you selected. |
| Gap (heatmap cell, signal-table cell) PRO | −100 .. +100 | strength(base) − strength(quote) on that TF. Positive = base strong vs quote (LONG setup). Negative = base weak vs quote (SHORT setup). The bigger the magnitude, the cleaner the divergence. |
| |Avg gap| PRO | 0 – 100 | Mean of |gap| across active TFs. Sort key for the heatmap. Pairs with high |avg gap| are the ones where the divergence is consistent. |
| Impulse (track bar) PRO | −100 .. +100 | Strength change over the ImpulsePeriod bars on the primary TF. Right of centre = rising. Bar fills up to 48% width on each side, scaled to the panel's max |impulse|. |
| Acceleration (↑ / · / ↓) PRO | −100 .. +100 | ROC of impulse. ↑ = impulse is itself rising (accelerating). ↓ = impulse is falling (decelerating). · = roughly unchanged. |
| Alert log | FREE: last 3 · PRO: last 100 filterable | Newest first. Each alert fires once per crossover. PRO supports type filters: All / Strength / Rank / Impulse. |
| Market-closed chip | on / off | When the latest bar of EURUSD is more than 2 × timeframe hours old, the chip turns on and shows the last bar's day + time. Useful if you opened the dashboard over the weekend. |
Configurable parameters — full reference (21)
Every parameter exposed by the plugin. Six groups. Tags FREE and PRO mark which editions expose the parameter. Counts audited against the source on 2026-06-29.
1 · Timeframes 4 params · PRO PRO
| Parameter | Default | Values | What it does |
|---|---|---|---|
| Primary TF (Ranking + Impulse) | H1 | any cTrader TF | The TF that drives the ranking bars and the impulse tracker. Other TFs show up in the heatmap and as extra columns in the signal table but don't affect the ranking order. |
| 2nd TF | H4 | any cTrader TF | First cross-TF check. Set it to one step higher than the primary (e.g. primary H1, 2nd H4) for the classic intraday-then-swing confirmation. |
| 3rd TF | D1 | any cTrader TF | Second cross-TF check. D1 (daily) is the typical "where is this currency going structurally?" anchor. |
| 4th TF (blank = skip) | M15 | any cTrader TF · blank to disable | Fourth and final TF. Set to M5/M15 for scalpers, to W1 for position traders, leave blank to keep only 3 TFs (lower CPU). |
2 · Calculation 7 params (5 in FREE)
| Parameter | Default | Values | What it does |
|---|---|---|---|
| Timeframe FREE | H1 | any cTrader TF | The single TF all strength scores are computed on. M5 = scalper. H1/H4 = intraday swing. D1/W1 = position. Lower TF = noisier; higher TF = slower. |
| Strength period (bars) | 50 | 10 – 200 | Per-pair return lookback, applied to every active TF. 50 on H1 ≈ 2 trading days; 200 on H1 ≈ 8 days. Shorter = more reactive (and noisier). Longer = smoother but lags. |
| ATR period | 14 | 5 – 50 | ATR window used to normalise returns. 14 is the conventional Wilder ATR. Larger = more smoothing of the volatility denominator. |
| Min-max window | 150 | 50 – 500 | How many bars of raw-score history feed the [0..100] normalisation. 150 on H1 ≈ 6 trading days; 500 on H1 ≈ 3 weeks. Larger = the 0/100 extremes are harder to reach. |
| Impulse period (bars) PRO | 5 | 1 – 30 | Lookback for the ROC that produces impulse. 5 on H1 ≈ 5 hours. Higher = smoother, slower signal. Lower = noisier, faster signal. |
| Min gap for signal pairs | 25 | 10 – 60 | Minimum strength gap (base − quote) to surface a pair in the top-N. Lower = noisier signals. Higher = only the cleanest setups. |
| Top pairs to show PRO | 8 | 3 – 20 | How many of the ranked pairs the signal table renders. 8 covers the most useful setups; 20 only makes sense on bigger screens. FREE is fixed at top 5. |
3 · Thresholds 3 params (1 in FREE)
| Parameter | Default | Values | What it does |
|---|---|---|---|
| Extreme low (oversold) | 20 | 5 – 40 | Below this strength → OVERSOLD alert fires (rising edge). Error popup on PRO. |
| Extreme high (overbought) | 80 | 60 – 95 | Above this strength → OVERBOUGHT alert fires (rising edge). Partial popup on PRO. |
| Impulse threshold PRO | 15 | 5 – 40 | |impulse| above this → impulse surge alert. 15 means a 15-unit strength change over the ImpulsePeriod bars. Lower = more alerts. |
4 · Alert types 3 params (1 in FREE)
| Parameter | Default | Values | What it does |
|---|---|---|---|
| Alert: strength extremes | true | bool | Master switch for the overbought/oversold rising-edge alert. Present in both editions. |
| Alert: ranking cross PRO | true | bool | Fires when two currencies swap position in the ranking (e.g. EUR moves from rank 3 to rank 2, displacing GBP). Rising-edge only. |
| Alert: impulse surge PRO | false | bool | Fires when |impulse| crosses the ImpulseThreshold. Off by default because it can be chatty on M5/M15. Turn on for M30/H1+ swing traders. |
5 · Alert delivery 3 params · all PRO PRO
| Parameter | Default | Values | What it does |
|---|---|---|---|
| Popup alerts PRO | true | bool | Show cTrader popup notification on each alert. OVERSOLD fires Error (red), OVERBOUGHT fires Partial (orange). FREE always fires popups (not configurable). |
| Sound alerts PRO | true | bool | Play cTrader notification sound. NegativeNotification for OVERSOLD, PositiveNotification for OVERBOUGHT and the other two alert types. FREE always plays sounds (not configurable). |
| Email alerts (uses cTrader email settings) PRO | false | bool | Routes alerts through cTrader's configured SMTP. Currently logged + Print-stubbed (v1.0); wired-up outgoing email is on the v1.1 roadmap. Not present in FREE. |
6 · Other 1 param · PRO PRO
| Parameter | Default | Values | What it does |
|---|---|---|---|
| Refresh interval (seconds) | 5 | 3 – 60 | How often the dashboard re-pulls bars and re-renders. 5s is the sweet spot. 3s makes the heatmap feel live; 30s+ lowers CPU and cTrader API pressure. FREE is fixed at 5s. |
Edition totals (audited 2026-06-29 from source): FREE exposes 8 parameters — 5 in Settings (Timeframe, Strength period, ATR period, Min-max window, Min gap) + 3 in Alerts (strength extremes on/off, Extreme low, Extreme high). Popup and Sound are always on in FREE — not user-configurable. PRO exposes 20 parameters across the same 6 groups (4 Timeframes + 6 Calculation + 3 Thresholds + 3 Alert types + 3 Alert delivery + 1 Other).
Quick usage manual
Same flow for both editions; PRO adds steps for the heatmap / impulse / extra alerts.
Install the plugin
From the cTrader Store add FX Strength Pulse (Free) or FX Strength Pulse PRO. It appears under Plugins as a cTrader tab. Open it and dock it wherever you like (right side recommended so the chart stays big).
Set your timeframe(s)
FREE: a single TF in Timeframe (default H1). PRO: up to 4 TFs in Tf1–Tf4. Defaults M15/H1/H4/D1 are the classic intraday-then-swing ladder. Scalpers → M5/M15/H1/H4. Position traders → H4/D1/W1 + a 4th blank (saves CPU). The first TF is the "primary" that drives the ranking + impulse.
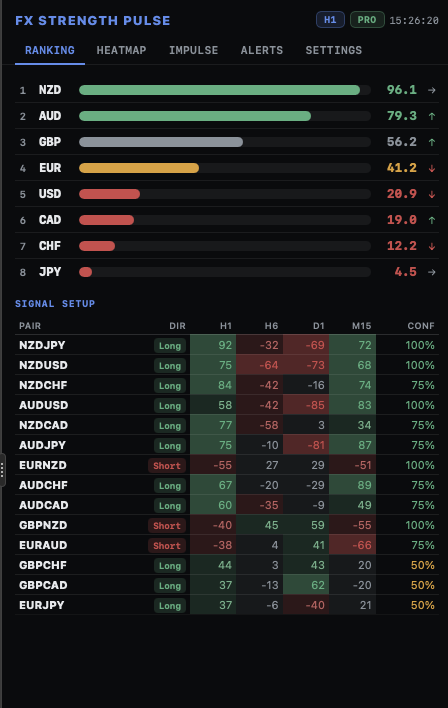
Read the ranking first
Glance at the 8 bars. Which currency sits at the top (strongest) and which at the bottom (weakest)? The colour tells you whether they're extreme (≥ 70 / ≤ 30) or just leaning. PRO adds an arrow on each bar showing the impulse sign — it tells you whether the move is fresh or already tired.
Check the signal pairs
Below the ranking, the top-N pairs table shows pairs where one currency is meaningfully stronger than the other. LONG = buy the first currency / sell the second. SHORT = the inverse. Confluence < 50% means the gap is thin — ignore. PRO renders one gap column per TF so you can see which TF the divergence is widest on.
Move to the Heatmap tab PRO
Sort is by |avg gap| (default). Read horizontally first: which pairs are green across all columns? Those are the cleanest multi-TF setups. Then read vertically: which TF column has the most dark cells? That's where the action is concentrated.
Switch to Impulse when the ranking is noisy PRO
If two currencies are both at 75+ on the ranking but their impulses point in opposite directions, the move is exhausted on one and fresh on the other. The impulse tab makes this obvious at a glance.
Configure your alerts
FREE: leave Alert: strength extremes = true; tune the two thresholds. PRO: start with strength + ranking-cross on (the defaults), impulse off. Use the Alerts tab to spot-check what's firing. If the alert log fills up with ranking-cross noise, raise MinGap — weak ranking swaps don't add info.
Set delivery channels
Popup + Sound work out of the box on both editions. PRO adds Email — currently a v1.1 deliverable; for now, the plugin logs the would-be email payload to the cTrader log so you can verify the format (EMAIL ALERT [type] subject: msg).
Read the Settings tab PRO
PRO has a dedicated Settings tab that mirrors every parameter currently active. Use it to confirm what the numbers mean after any edit. FREE doesn't have this tab — refer to the cTrader instance parameter list.
Watch for market-closed
If the dashboard shows MARKET CLOSED, the market hasn't opened for the new bar (weekend, holiday). The bars still display the last value; alerts stay quiet. The chip disappears automatically once a fresh bar arrives.
Honest notes
- Read-only by design. It's a plugin with
AccessRights.None: it cannot open, modify or close orders. It reads bars and renders numbers. There is no path through which this tool can place a trade. - Not a signal service. The dashboard surfaces currency strength, gap, confluence and impulse. It does not produce entry/exit levels, stop-loss, take-profit, position sizing, or a "BUY / SELL now" verdict. It is a situational-awareness tool.
- Not affiliated with any broker or feed. All numbers come from your connected cTrader account via
MarketData.GetBars. History depth depends on what your broker exposes. - No data leaves your machine. No external HTTP calls, no analytics, no telemetry. The only output channels are cTrader-native popup/sound (and your screen).
- The 0..100 scale is per-currency. EUR=70 and USD=70 means each is near its own recent high, not that they are equally strong. To compare currencies use the ranking order, not the absolute number.
- PRO multi-TF cost. 4 TFs × 28 pairs = 112
GetBarshandles. On a slow broker this can take a few seconds on first load — the dashboard shows aLoading N/28 pairs…progress until all four TFs are populated. After that it refreshes incrementally. - PRO email is a v1.1 deliverable. v1.0 prints the would-be email payload to the cTrader log. It does not silently swallow alerts.
- No backtest. This is a live plugin; Plugins don't run in cTrader's backtester by design. The indicator overlay (with historical strength lines) is on the v1.1 roadmap.
- Trading involves risk. This tool does not give financial advice. Backtest before you trust any method, and verify in a demo account first.