
Prop-firm cBot
Balanced
A broader mix. A balanced approach.
12 strategies · 8 markets
Total ROI+322.25%
Annualized (CAGR)+29.03%
PF / trade1.67
Max. equity DD−5.26%
Historical backtest · 2021–2026Prop-firm portfolio
A measured start for prop trading.
8 strategies across 6 markets. A single cBot, with a historical report you can inspect and a Free edition to test.
Starts at $15 per strategy. Every 5 sales, the price per strategy increases by $5, up to $75.
| Prior sales | Per strategy | Total |
|---|---|---|
| 0 | $15 | $120 |
| 5 | $20 | $160 |
| 10 | $25 | $200 |
| 15 | $30 | $240 |
| 20 | $35 | $280 |
| 25 | $40 | $320 |
| 30 | $45 | $360 |
| 35 | $50 | $400 |
| 40 | $55 | $440 |
| 45 | $60 | $480 |
| 50 | $65 | $520 |
| 55 | $70 | $560 |
| 60 | $75 | $600 |
8 strategies. One purchase, no subscription. Early buyers pay the least. Active price on the cTrader Store.
Check Store price
Published historical evidence
5y 7m 26d (04/01/2021 - 30/08/2026) · Report reference v4.1
Balance curve from the published backtest. The drawdown metric above refers to equity.
Sampled historical curve. These points are not a trade ledger or an intraday equity series.
| Date | Growth |
|---|---|
| 2021-01-04 | 0.00% |
| 2021-01-15 | -1.99% |
| 2021-01-27 | 0.79% |
| 2021-02-10 | 0.40% |
| 2021-02-26 | 1.72% |
| 2021-03-08 | 0.92% |
| 2021-03-24 | -0.98% |
| 2021-04-14 | -0.44% |
| 2021-04-26 | -0.34% |
| 2021-05-06 | -0.06% |
| 2021-05-19 | 2.58% |
| 2021-06-01 | 2.45% |
| 2021-06-14 | 2.06% |
| 2021-06-23 | 2.49% |
| 2021-07-12 | 5.39% |
| 2021-07-27 | 5.04% |
| 2021-08-13 | 7.51% |
| 2021-08-30 | 11.73% |
| 2021-09-09 | 9.75% |
| 2021-09-21 | 8.85% |
| 2021-10-05 | 8.44% |
| 2021-10-21 | 7.66% |
| 2021-11-03 | 9.38% |
| 2021-11-12 | 12.63% |
| 2021-11-23 | 13.52% |
| 2021-12-02 | 13.59% |
| 2021-12-20 | 12.66% |
| 2022-01-04 | 17.46% |
| 2022-01-12 | 16.91% |
| 2022-01-24 | 15.94% |
| 2022-02-03 | 17.45% |
| 2022-02-14 | 19.93% |
| 2022-02-23 | 25.61% |
| 2022-03-02 | 23.60% |
| 2022-03-09 | 26.37% |
| 2022-03-28 | 28.35% |
| 2022-04-18 | 29.75% |
| 2022-04-28 | 33.52% |
| 2022-05-11 | 38.11% |
| 2022-05-27 | 41.72% |
| 2022-06-10 | 44.85% |
| 2022-06-20 | 45.84% |
| 2022-07-05 | 48.24% |
| 2022-07-20 | 49.47% |
| 2022-08-05 | 48.86% |
| 2022-08-22 | 50.89% |
| 2022-09-02 | 50.67% |
| 2022-09-12 | 50.44% |
| 2022-09-21 | 51.28% |
| 2022-09-28 | 52.36% |
| 2022-10-11 | 54.72% |
| 2022-10-27 | 54.13% |
| 2022-11-08 | 56.53% |
| 2022-11-18 | 56.38% |
| 2022-12-08 | 56.50% |
| 2022-12-21 | 54.91% |
| 2023-01-06 | 54.47% |
| 2023-01-17 | 58.04% |
| 2023-01-27 | 57.51% |
| 2023-02-06 | 62.36% |
| 2023-02-20 | 61.76% |
| 2023-03-08 | 61.74% |
| 2023-03-15 | 60.91% |
| 2023-03-21 | 62.07% |
| 2023-04-10 | 63.43% |
| 2023-04-23 | 62.54% |
| 2023-05-07 | 65.17% |
| 2023-05-18 | 65.61% |
| 2023-05-30 | 68.99% |
| 2023-06-12 | 68.13% |
| 2023-06-19 | 68.16% |
| 2023-06-30 | 67.10% |
| 2023-07-12 | 66.71% |
| 2023-07-27 | 66.92% |
| 2023-08-14 | 67.35% |
| 2023-08-28 | 66.94% |
| 2023-09-12 | 67.13% |
| 2023-09-21 | 65.34% |
| 2023-09-29 | 67.62% |
| 2023-10-11 | 66.91% |
| 2023-10-19 | 68.88% |
| 2023-10-26 | 72.61% |
| 2023-11-15 | 72.92% |
| 2023-12-01 | 75.49% |
| 2023-12-08 | 75.44% |
| 2023-12-20 | 77.46% |
| 2024-01-15 | 78.23% |
| 2024-01-30 | 79.98% |
| 2024-02-07 | 78.00% |
| 2024-02-20 | 80.84% |
| 2024-03-04 | 87.60% |
| 2024-03-12 | 90.78% |
| 2024-03-25 | 89.10% |
| 2024-04-04 | 88.80% |
| 2024-04-17 | 89.09% |
| 2024-05-06 | 88.78% |
| 2024-05-20 | 93.29% |
| 2024-06-04 | 92.49% |
| 2024-06-14 | 96.19% |
| 2024-06-27 | 97.51% |
| 2024-07-10 | 100.84% |
| 2024-07-23 | 104.98% |
| 2024-08-05 | 105.35% |
| 2024-08-16 | 107.03% |
| 2024-09-04 | 106.41% |
| 2024-09-18 | 107.59% |
| 2024-09-26 | 111.68% |
| 2024-10-10 | 111.69% |
| 2024-10-23 | 111.66% |
| 2024-11-05 | 110.60% |
| 2024-11-11 | 111.60% |
| 2024-11-19 | 115.14% |
| 2024-12-02 | 113.51% |
| 2024-12-09 | 119.57% |
| 2024-12-20 | 119.69% |
| 2025-01-08 | 118.81% |
| 2025-01-20 | 120.42% |
| 2025-01-28 | 121.86% |
| 2025-02-10 | 124.91% |
| 2025-02-21 | 124.25% |
| 2025-03-06 | 123.92% |
| 2025-03-19 | 124.34% |
| 2025-03-31 | 125.32% |
| 2025-04-08 | 132.36% |
| 2025-04-21 | 134.96% |
| 2025-05-01 | 133.40% |
| 2025-05-21 | 136.91% |
| 2025-06-09 | 135.56% |
| 2025-06-23 | 133.08% |
| 2025-07-07 | 133.69% |
| 2025-07-17 | 135.56% |
| 2025-07-28 | 135.94% |
| 2025-08-07 | 137.88% |
| 2025-08-21 | 137.07% |
| 2025-09-04 | 137.48% |
| 2025-09-19 | 141.09% |
| 2025-10-01 | 142.76% |
| 2025-10-14 | 148.27% |
| 2025-10-22 | 147.02% |
| 2025-11-05 | 151.47% |
| 2025-11-18 | 150.91% |
| 2025-12-03 | 153.10% |
| 2025-12-18 | 153.15% |
| 2026-01-02 | 152.36% |
| 2026-01-13 | 153.34% |
| 2026-01-28 | 155.34% |
| 2026-02-05 | 156.40% |
| 2026-02-24 | 157.51% |
| 2026-03-09 | 158.12% |
| 2026-03-19 | 161.32% |
| 2026-03-27 | 164.01% |
| 2026-04-07 | 162.58% |
| 2026-04-23 | 165.56% |
| 2026-05-06 | 167.80% |
| 2026-05-18 | 166.44% |
| 2026-06-01 | 167.83% |
| 2026-06-10 | 166.81% |
| 2026-06-18 | 169.20% |
| 2026-07-03 | 173.30% |
| 2026-07-21 | 172.14% |
| 2026-08-03 | 172.42% |
| 2026-08-12 | 173.57% |
| 2026-08-24 | 172.94% |
| 2026-08-28 | 171.48% |
| Year | Jan | Feb | Mar | Apr | May | Jun | Jul | Aug | Sep | Oct | Nov | Dec |
|---|---|---|---|---|---|---|---|---|---|---|---|---|
| 2021 | +0.4% | +1.3% | −3.4% | +0.9% | +3.1% | +1.5% | +1.2% | +6.2% | −2.3% | −0.5% | +4.6% | +1.8% |
| 2022 | +2.0% | +4.6% | +3.9% | +4.8% | +5.0% | +4.7% | +1.2% | +0.8% | +1.0% | +1.5% | +1.1% | −1.1% |
| 2023 | +2.8% | +1.6% | +1.9% | −0.3% | +3.2% | −1.1% | −0.0% | +0.2% | +0.3% | +2.8% | +1.8% | +1.5% |
| 2024 | +0.4% | +2.9% | +3.7% | −1.3% | +2.5% | +1.9% | +3.8% | +1.3% | +2.3% | −0.3% | +1.2% | +2.7% |
| 2025 | +1.8% | +0.5% | +0.4% | +3.9% | +1.3% | −1.4% | +1.1% | +0.1% | +2.8% | +3.1% | +1.0% | −0.5% |
| 2026 | +1.6% | +0.2% | +3.2% | +0.2% | +0.8% | +1.0% | +0.7% | −0.4% |
Balance return per calendar month, from the cTrader report.
Demo tracking · virtual funds
History since 2026-07-22 · Skilling demo account · EUR

Account data updated by Myfxbook: 2026-11-02 11:33 GMT
Last check by our website: 2026-11-02 11:35 UTC
Why Guardian
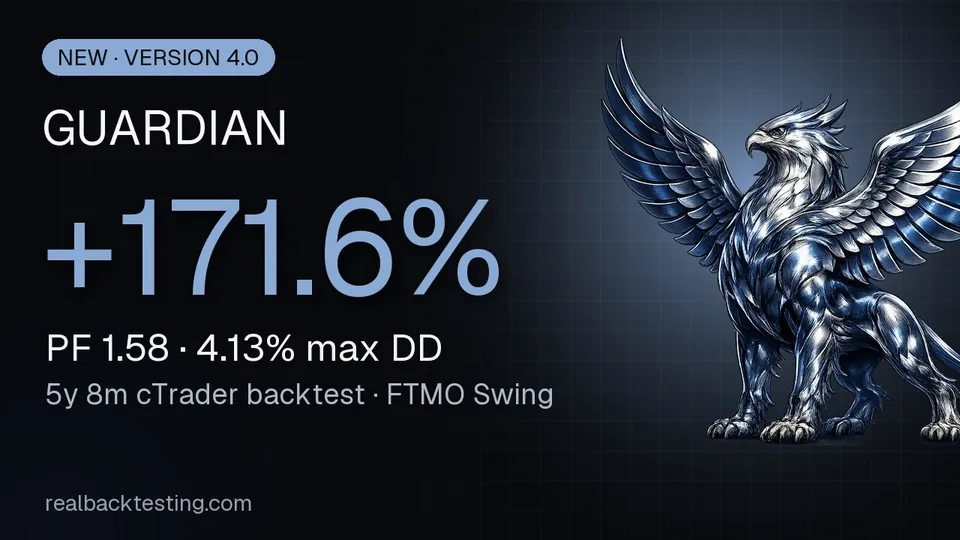
cTrader backtest on FTMO, 2021-01-04 → 2026-08-30, m1 bars from the broker's server, fixed 2-pip spread, commissions and swaps, €80,000 start. Trading involves risk; past results do not guarantee future results.
Verify it yourself
Step by step: how to run the Guardian backtest in cTrader and read the report.
Pressing play loads the video from YouTube (youtube-nocookie.com).
Before you start
Use the report's data, period and settings to reproduce its run. Your broker and execution costs can change the result.
DAX 40, GBP/JPY, GBP/USD, Nasdaq 100, USD/JPY, Gold
| Market | Timeframe | Approach |
|---|---|---|
| DAX 40 | 1h | Breakout |
| DAX 40 | 6h | Regime |
| GBP/USD | 8h | Pullback |
| GBP/JPY | 4h | Seasonality |
| Nasdaq 100 | 2h | Trend |
| USD/JPY | 4h | Trend |
| Gold | 4h | Momentum |
| Gold | 6h | Volatility |
A 3.3% daily-loss guard and a 6.0% maximum-drawdown guard, on by default and adjustable. Prop-firm mode keeps those guards within the account rules.
Review the current software version and release history in the official Store. Historical reports keep their own version reference.
View version history in StoreFTMO Swing line
A broader mix. A balanced approach.
12 strategies · 8 markets
A wider portfolio, with more exposure.
14 strategies · 10 markets