Indicator · cTrader
Liquidity & Structure (SMC)
Read structure. See the context.
Market structure, liquidity and price imbalances in one overlay.
Free · Pro from $29 Confirm the current price in Store.
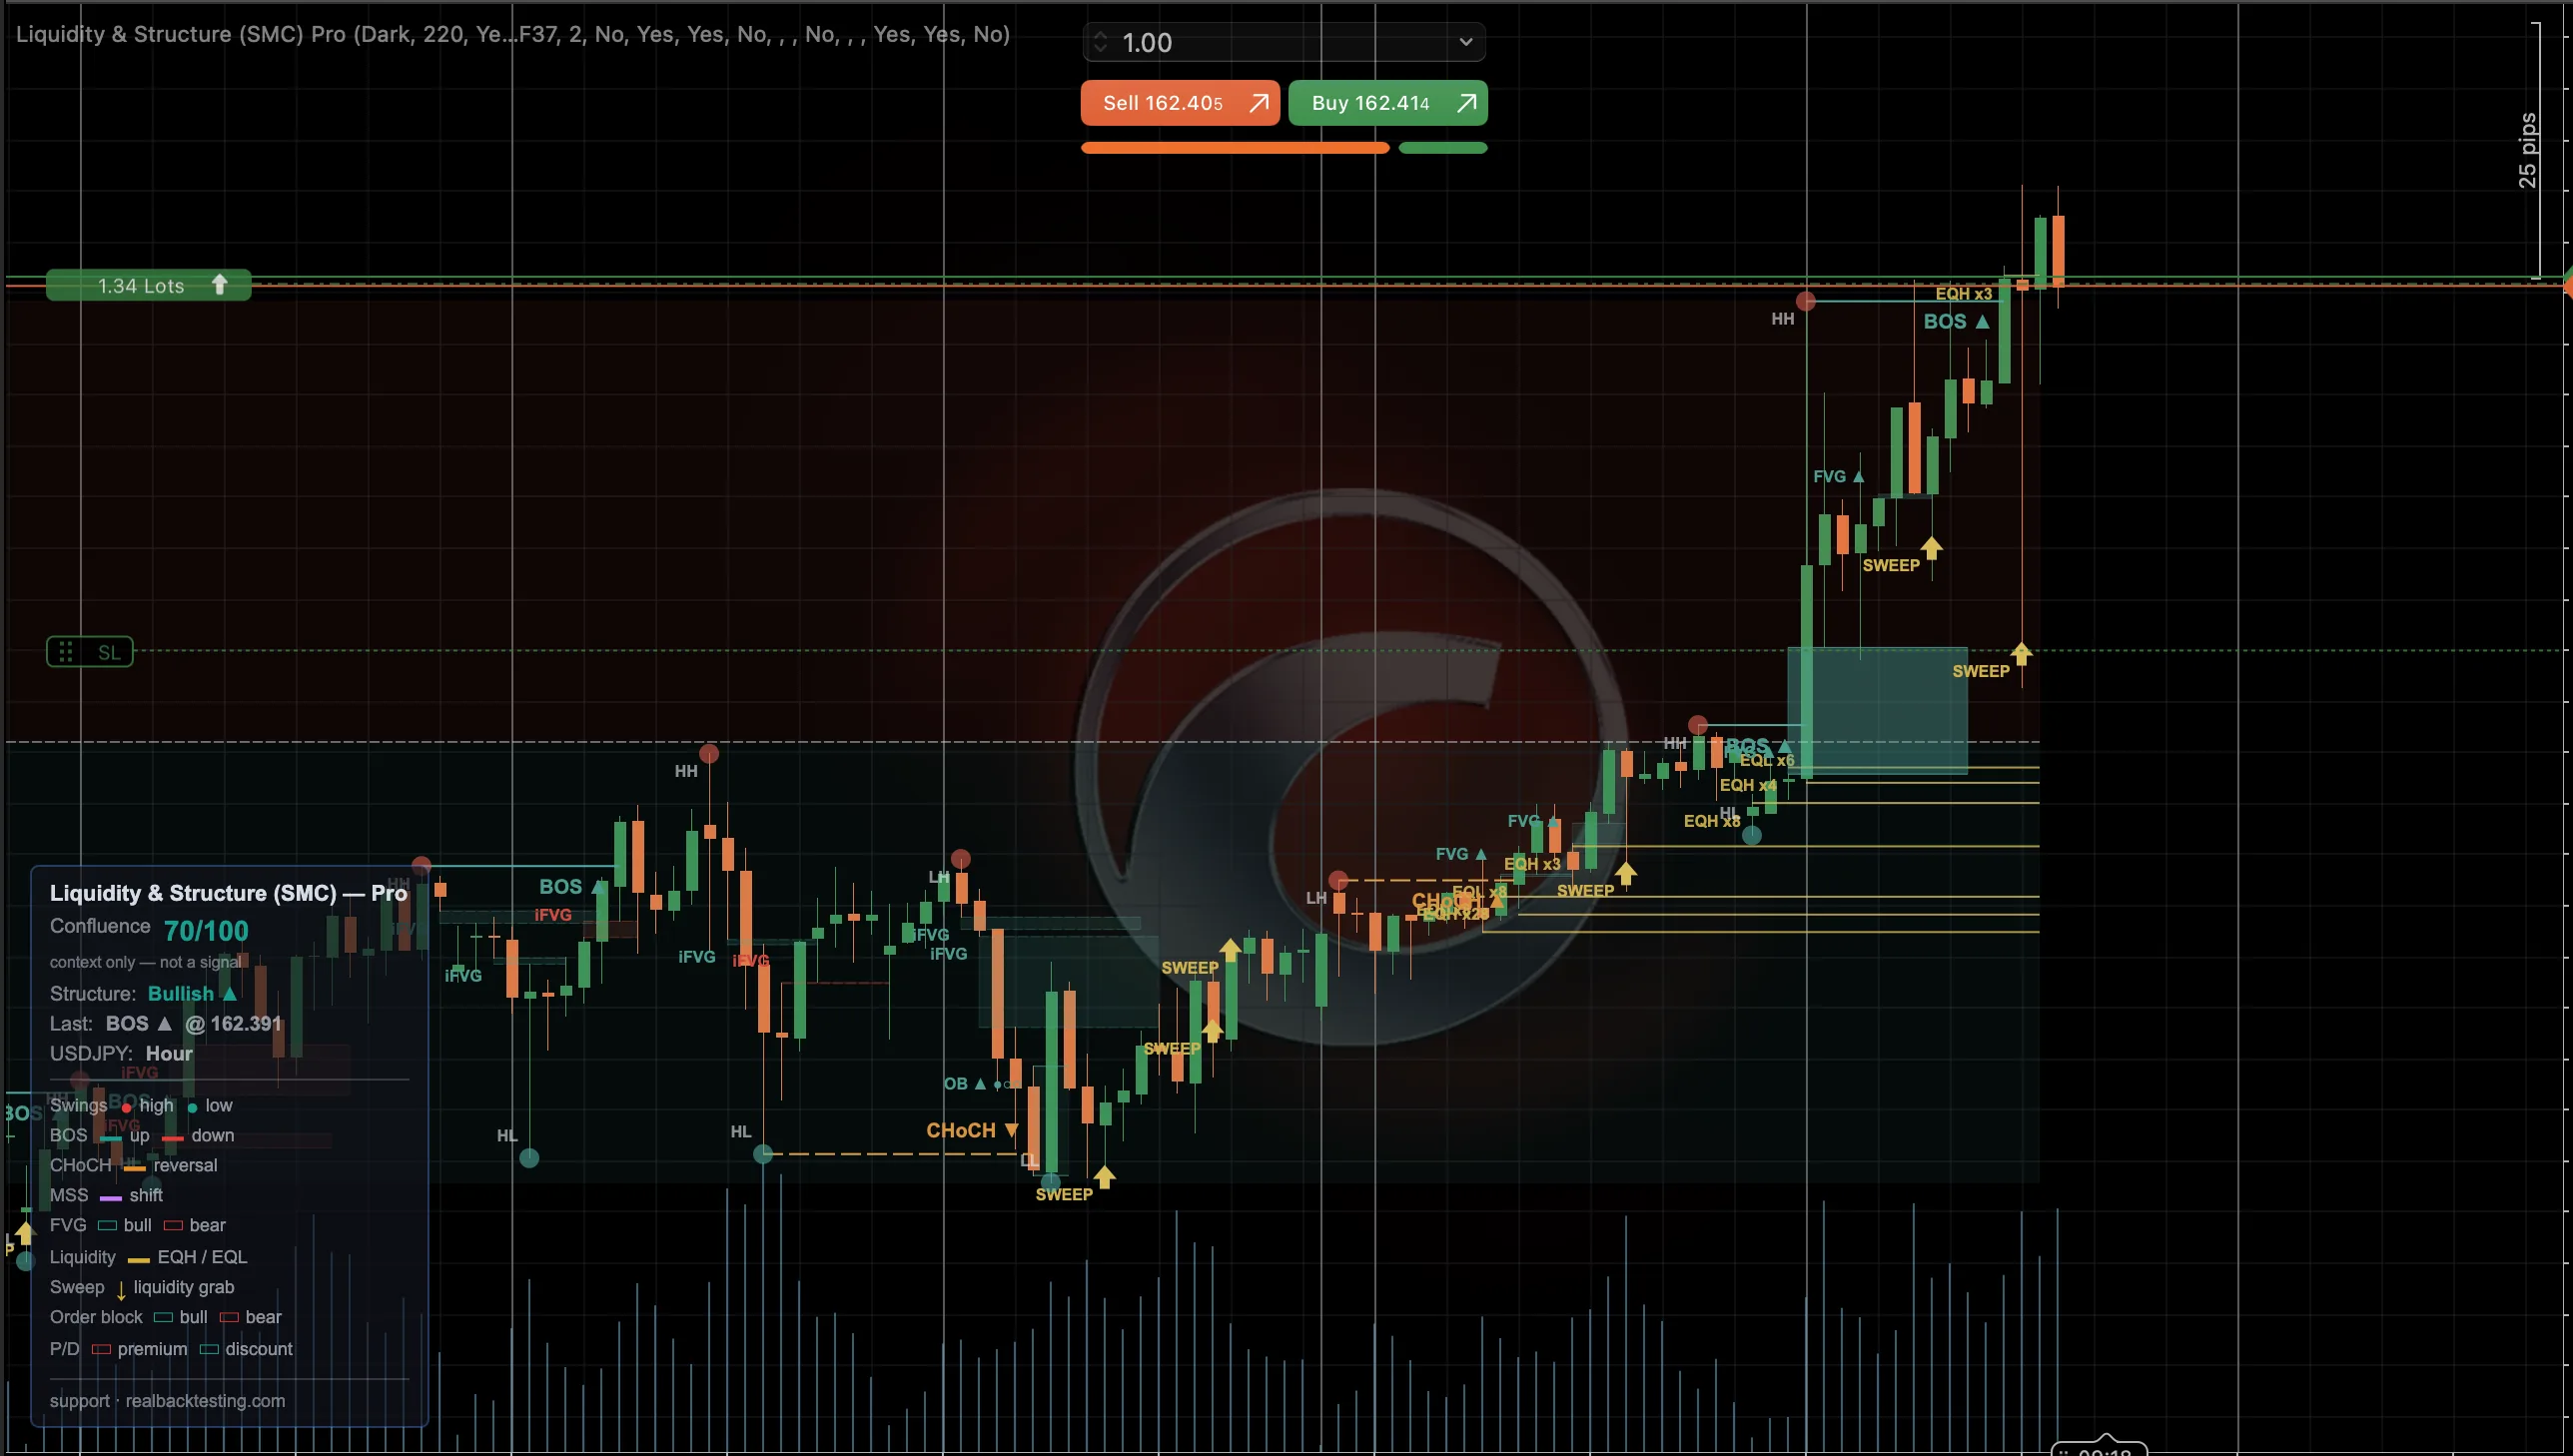 Enlarge screenshot ↗
Built for your workflow
For traders who use price structure and want its elements in one place.
Explore FVGs, order blocks and their context.
Review measured reactions on your chart.
See what you will use.
Complete screenshots. Open any image to inspect it at full size.
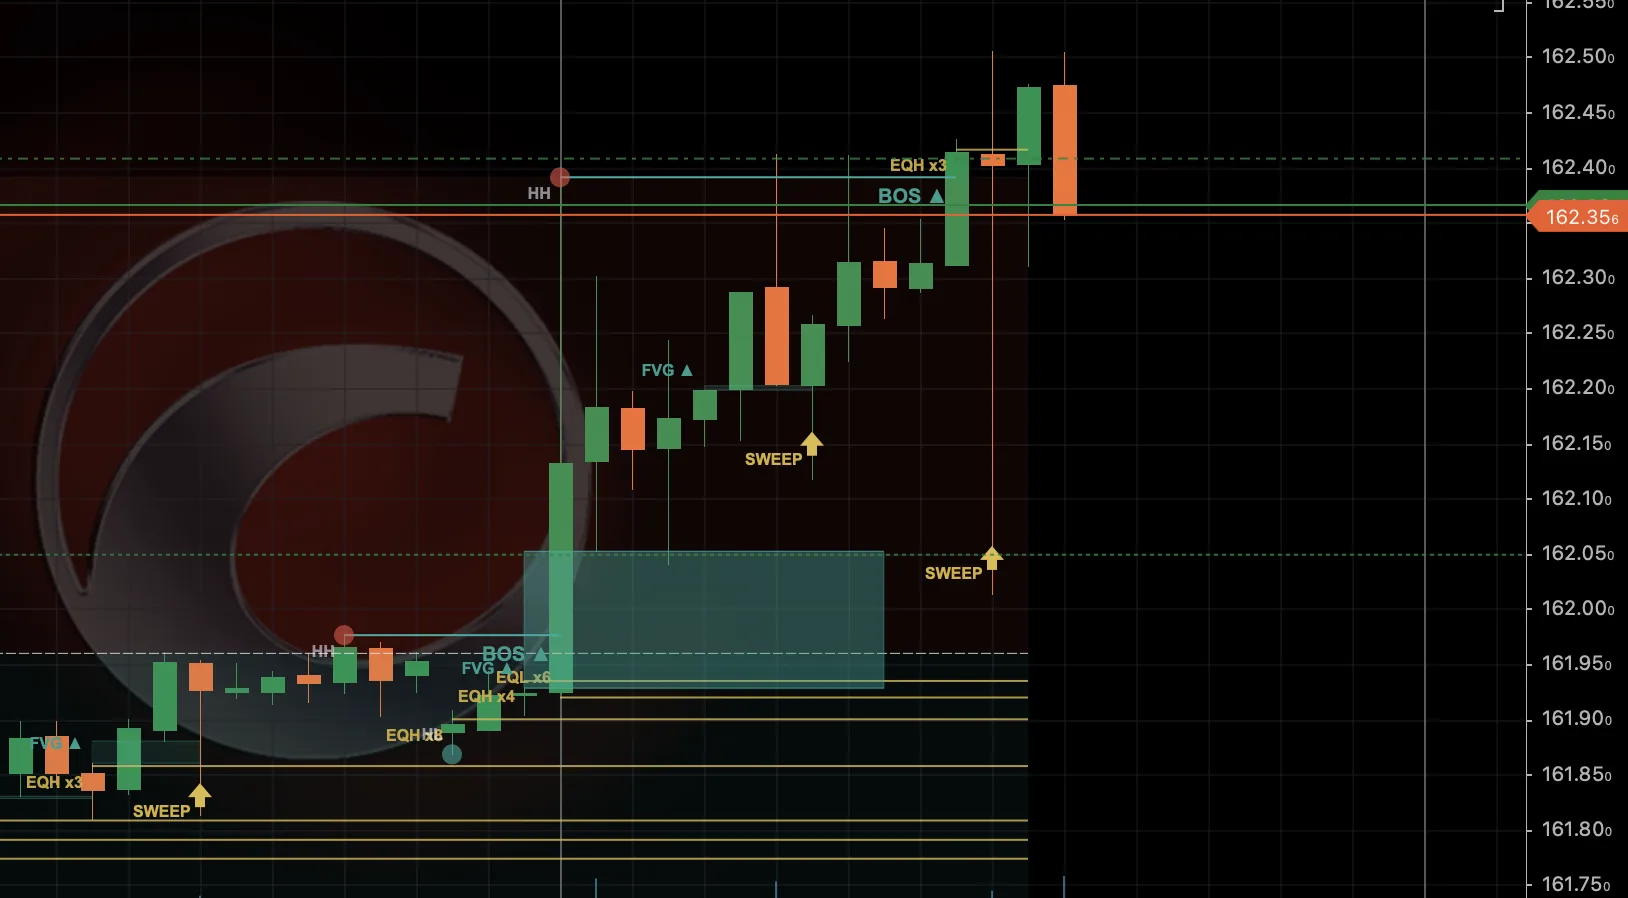
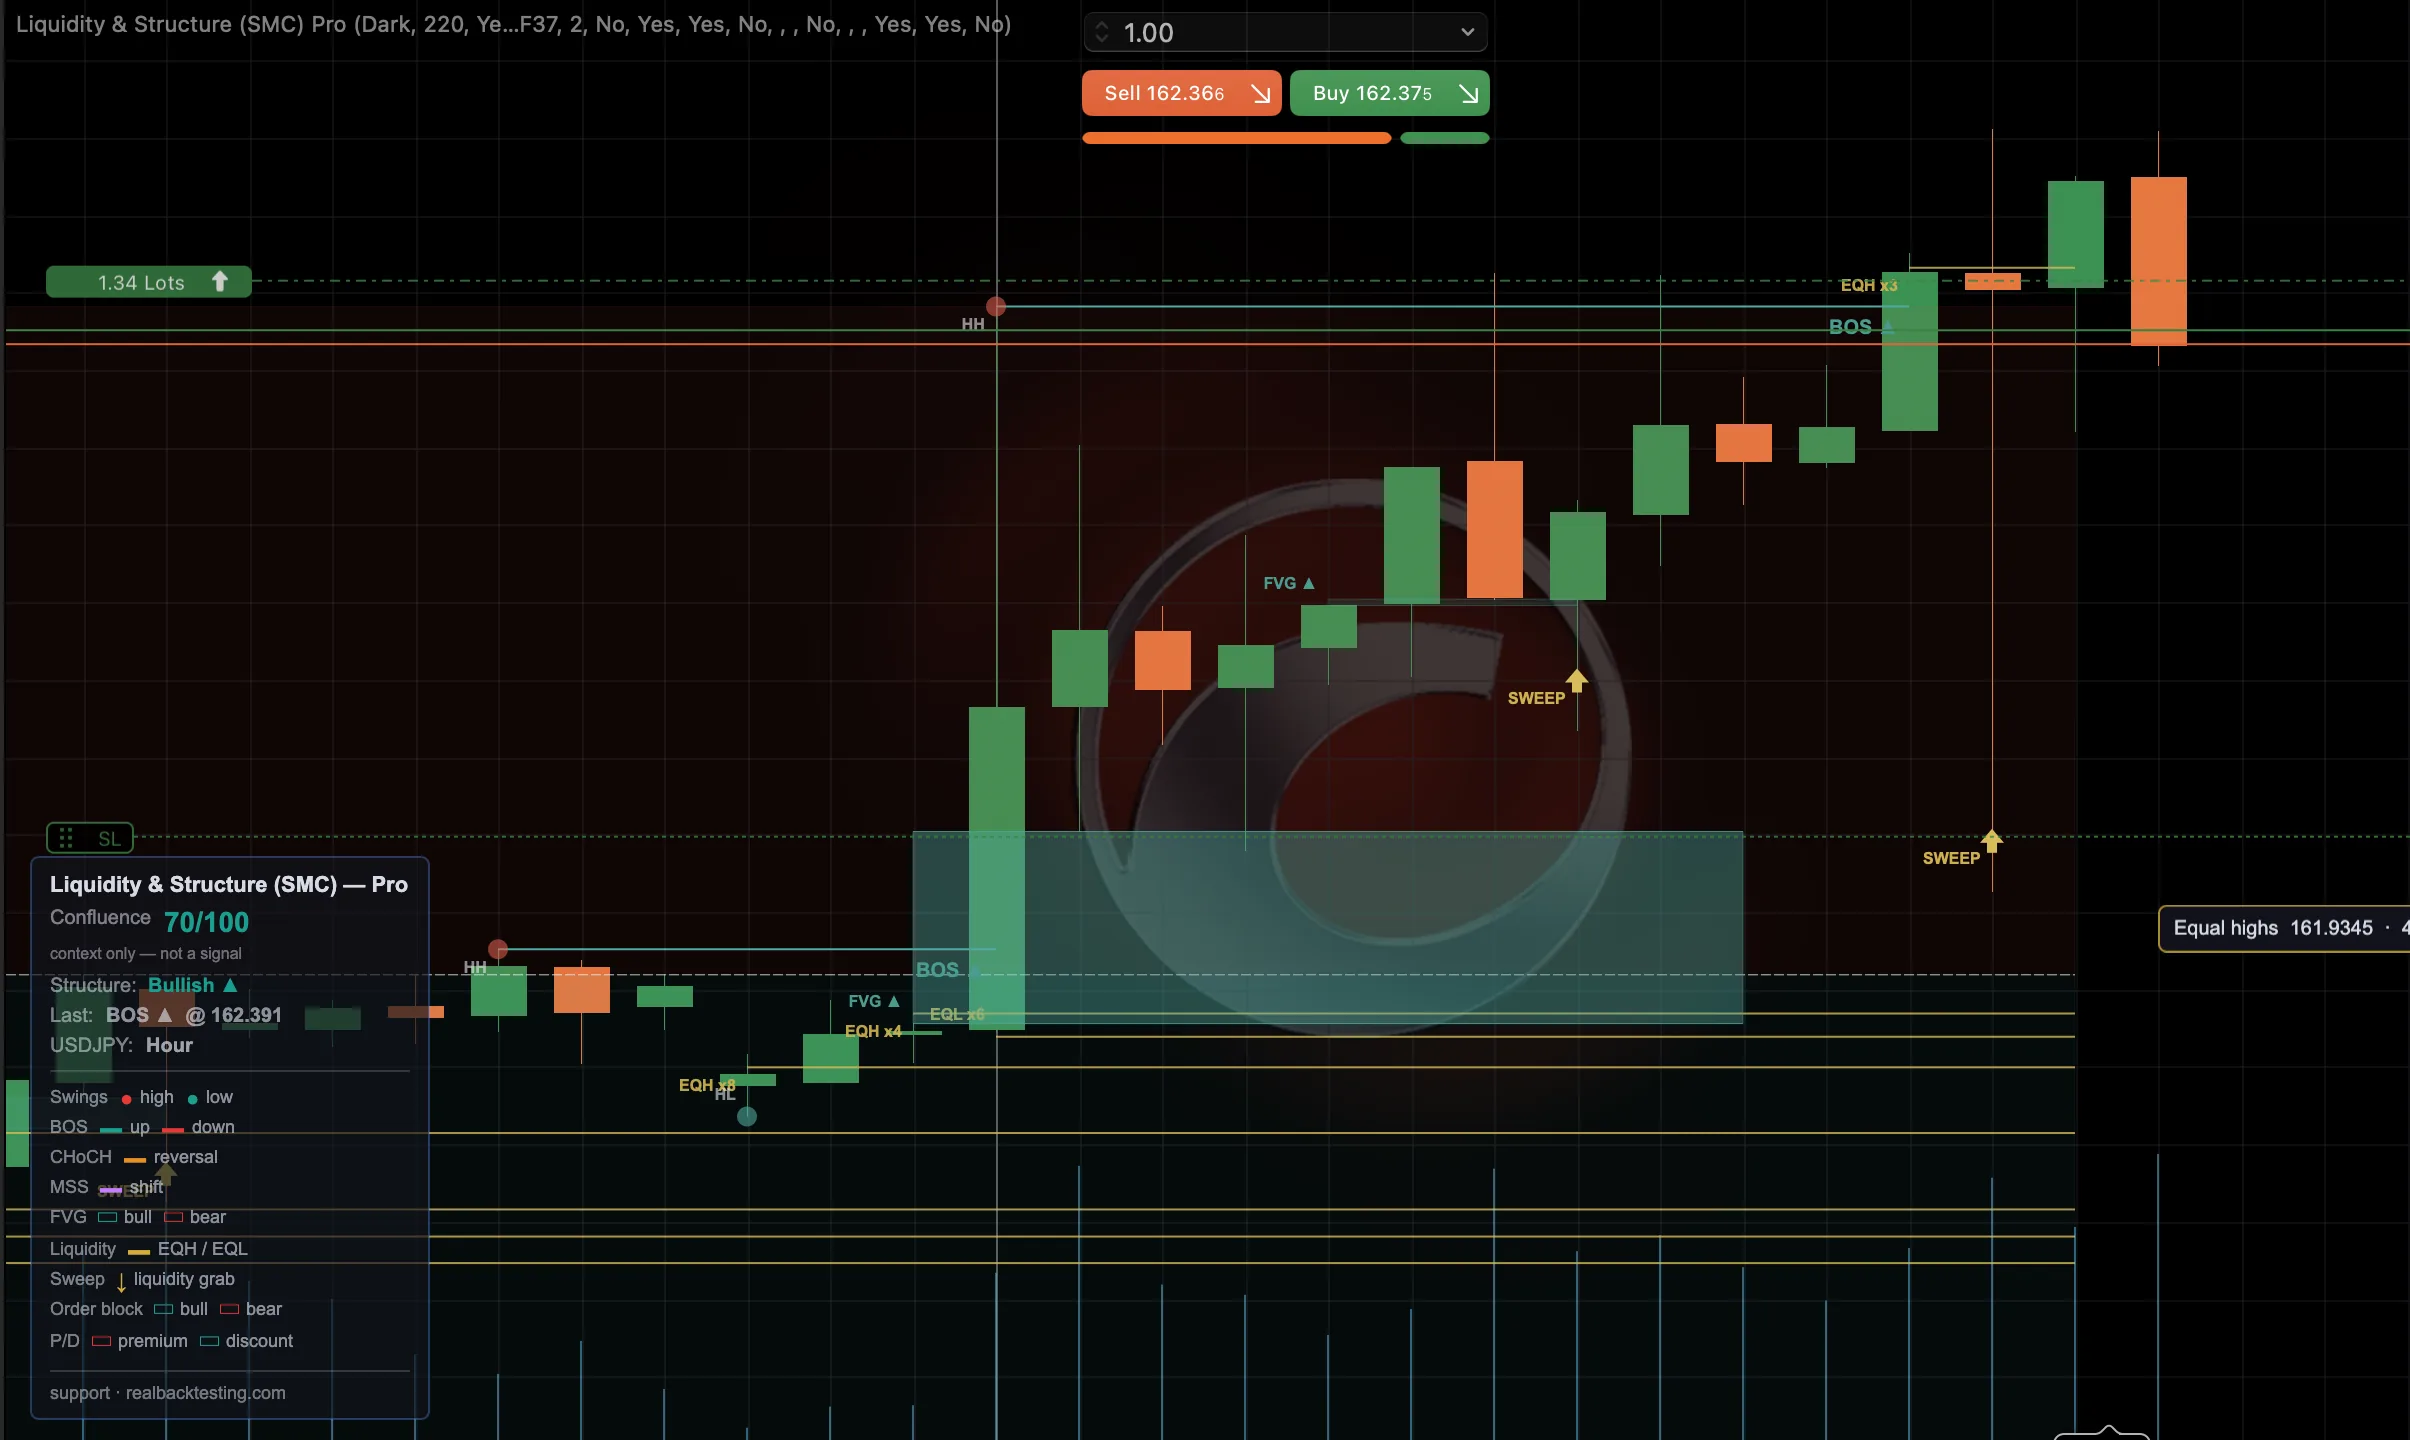
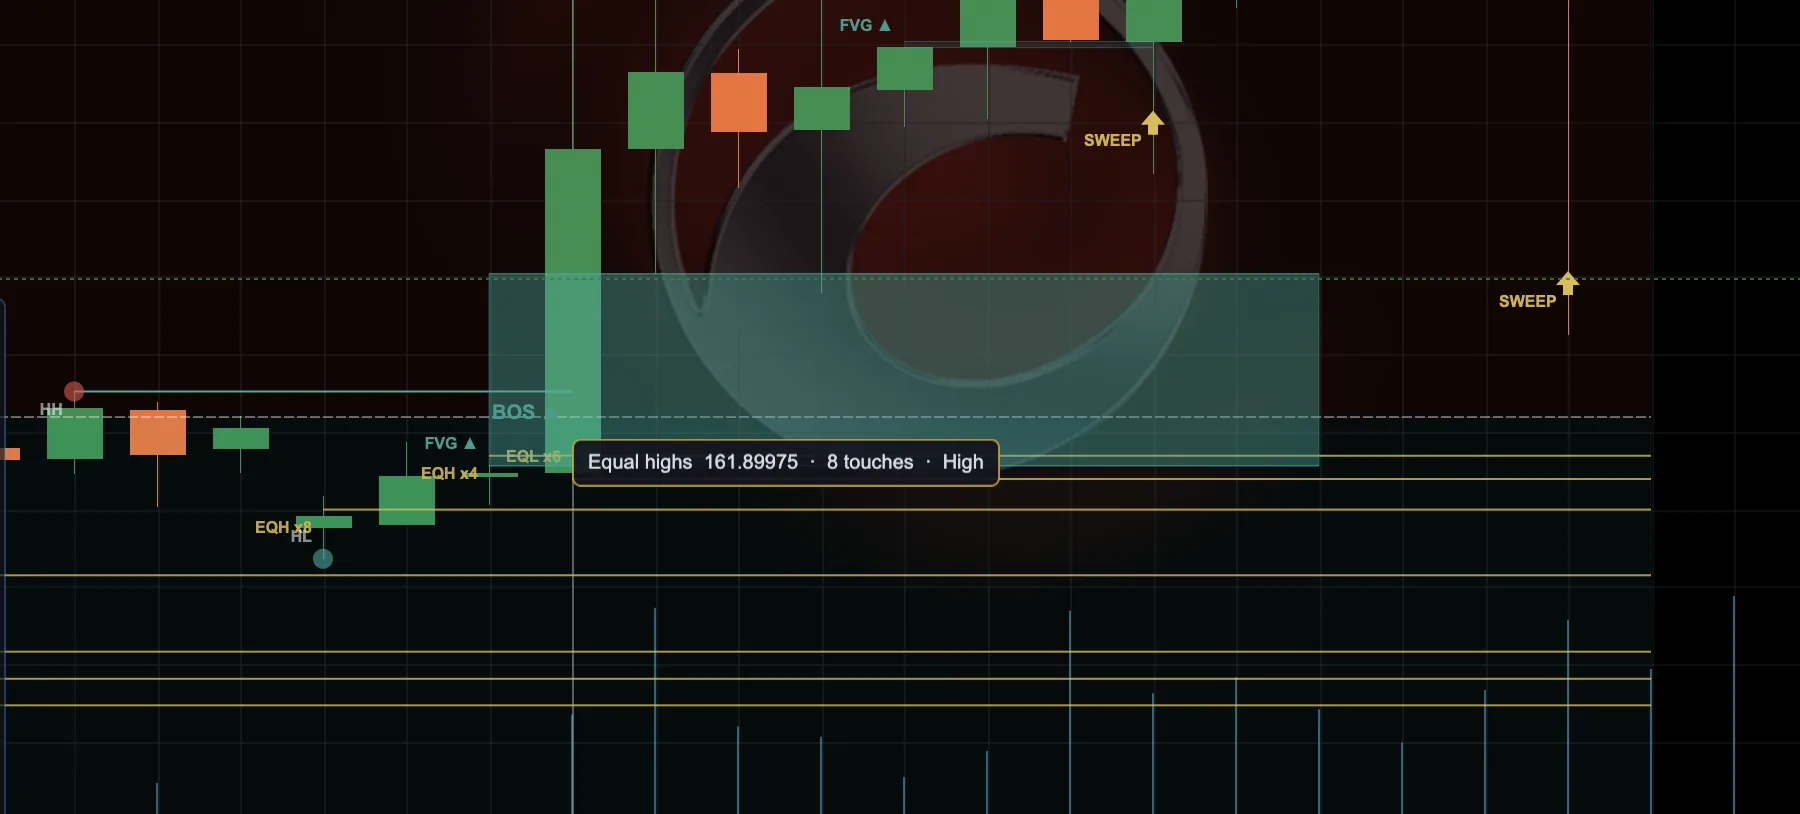
Choose your edition.
Start with the essentials.
Core structure, FVGs and liquidity context.
Go further in your workflow.
More confluence, multi-timeframe context and measurement options.
Full feature comparison
Free vs Pro — clear differences
The Free is no longer a trimmed demo: v2.0 turned on order blocks, liquidity pools, sweeps, premium/discount and the measurement layer — the engines already shipped inside the same DLL, switched off. It is a complete SMC suite that measures itself. The Pro adds what changes how you configure it: the full session breakdown, the auto-calibration, the entry comparison and the quality filter, plus MSS, multi-timeframe, the confluence score and the alert stack.
| Capability | Free | Pro · $29 |
|---|---|---|
| Market structure | ||
| Swing points + HH / HL / LH / LL labels | Yes | Yes |
| BOS + CHoCH (close-confirmed) | Yes | Yes |
| MSS — market structure shift (external swings) | — | Yes |
| Imbalance & liquidity | ||
| Fair value gaps (FVG) + mitigation | Yes | Yes |
| FVG minimum-size filter (xATR) | Yes | Yes |
| Inverse FVG | — | Yes |
| Liquidity pools — equal highs / lows | Yes | Yes |
| Liquidity sweeps (wick + close-back confirmation) | Yes | Yes |
| Zones & bias | ||
| Order blocks + displacement and body quality filters | Yes | Yes |
| Premium / discount + equilibrium | Yes | Yes |
| Confluence score 0–100 (context ranker) | — | Yes |
| Multi-timeframe structure context | — | Yes |
| Measured reliability — what nothing else in the category does | ||
| Hit rate measured on your chart (order blocks, FVG, sweeps) | Yes | Yes |
| History auto-load, so the number does not depend on how far you scrolled | Yes | Yes |
| Daylight saving handled automatically (market local clock) | Yes | Yes |
| Pick the clock for each session (London / New York / Frankfurt / Tokyo / UTC) | — | Yes |
| Session breakdown of the rate | 2 fixed bands | 3 sessions, configurable UTC windows |
| Auto-tune: best setting for this symbol, with the median of the sweep | — | Yes |
| FVG entry compared: edge vs 50% (consequent encroachment) | — | Yes |
| Touch delay — how long a level takes to be hit (percentiles 50 / 75 / 90) | — | Yes |
| Quality filter — hide order blocks below a measured rate | — | Yes |
| Chart, alerts & workflow | ||
| No-repaint · live HUD legend · click tooltips with exact prices | Yes | Yes |
| Configurable colours, widths, opacities and HUD corner · dark / light themes | Yes | Yes |
| Structure alerts (popup · sound) | Yes | Yes |
| Email + Telegram + per-event toggles (structure · sweep · OB) | — | Yes |
| Surface | ||
| Number of configurable parameters | 51 | 80 |
Getting started
Quick usage manual
From zero to a configured chart in five minutes.
Install the indicator in cTrader
From the cTrader Store, add Liquidity & Structure (SMC) (Free or Pro). In cTrader: Indicators tab → find it → Add to the chart.
Start simple, then layer up
Defaults are clean, and every layer is already in both editions. Begin with structure (swings, BOS/CHoCH) and FVG, then turn the rest on one at a time — liquidity pools, sweeps, order blocks, premium/discount — only what you actually use.
Let it measure before you judge it
The panel counts, on your own bars, how often price reacted at the zones it drew. It loads history in the background until that measurement is complete, so give it a few seconds — need 20+ means bars are missing, not that anything is broken. What each line means is in Reading the numbers.
Tune the structure sensitivity
Swing length controls how reactive the internal structure is (smaller = more swings). External swing length drives the MSS. Raise the liquidity Min touches for fewer, stronger pools.
Make it yours
Every colour is configurable in 9 · Style (hex), line width and box opacities too. Move the panel with HUD corner. Click any swing, level, gap or sweep to read its exact prices.
Read the confluence score
The HUD shows a 0–100 context score (sweep + structure + FVG + OB + liquidity + premium/discount + volatility). It is context, not a signal — it tells you how loaded the current spot is, not when to enter.
Enable your alerts (optional)
Set Enable alerts = true, pick events (structure, sweeps, OB tap) and channels (popup, sound, email, Telegram). For Telegram, paste your bot token and chat id.
Configuration
Parameter reference from the product documentation. Check names and options against your installed edition.
Configurable parameters — full reference
Every setting is an independent toggle with clean defaults, so each trader shapes their own chart. Rows tagged PRO exist only in the Pro edition; the rest are in both. Defaults and ranges below are read from the shipped binary, not typed from memory.
1 · General 5 params
| Parameter | Default | Values | What it does |
|---|---|---|---|
| Theme | Dark | Dark · Light | Palette of the on-chart info panel. Dark for dark charts, Light for light ones. |
| Display bars (recent) | 150 | 30..2000 (step 10.0) | How many recent bars to draw on. Lower = cleaner chart and faster redraw; it does not change what is detected. |
| Show info HUD | true | bool | The small summary panel on the chart: current structure, last event and a colour legend. |
| HUD corner | BottomLeft | TopRight · TopLeft · BottomRight · BottomLeft | Which corner the info panel docks to. Move it if it covers price. |
| Show click tooltips | true | bool | Click any zone or level to read its exact price and details. |
2 · Market Structure 6 params
| Parameter | Default | Values | What it does |
|---|---|---|---|
| Show swing points | true | bool | Mark the pivot highs and lows that everything else is built from. |
| Swing length | 5 | 2..50 | Bars required on each side of a pivot. Higher = fewer, more significant swings; lower = more, noisier ones. |
| Show HH/HL/LH/LL labels | true | bool | Label each swing as higher-high, higher-low, lower-high or lower-low. |
| Show BOS / CHoCH | true | bool | Break of structure (trend continues) and change of character (trend may be turning). |
| Show MSS (external) PRO | true | bool | Market structure shift on the slower, external swings. It answers a different question from BOS/CHoCH: not 'did the last leg break' but 'did the trend itself turn'. |
| External swing length PRO | 20 | 5..80 | Half-window for the structural swings that drive the MSS. Larger = only major turns qualify. Keep it well above Swing length or the two readings say the same thing. |
3 · Fair Value Gaps 7 params
| Parameter | Default | Values | What it does |
|---|---|---|---|
| Show FVG | true | bool | Fair value gaps: the three-bar imbalances price often returns to fill. |
| Show FVG label | true | bool | Write FVG on each gap. Turn off for a cleaner chart. |
| Hide mitigated FVG | false | bool | Hide gaps price has already filled. Off keeps them, drawn faded, as context. |
| FVG extend bars | 8 | 0..60 | How far to the right each gap is drawn. It stops early if price fills it. |
| FVG fill opacity (%) | 40 | 0..80 (step 2.0) | How solid the gap boxes look. 0 leaves only the outline. |
| FVG min size (xATR) | 0.25 | 0..5 (step 0.05) | Ignore gaps smaller than this multiple of ATR. 0 draws every gap - on H1 that is roughly one every 5 bars, which is what clutters a chart. 0.25 keeps about half. |
| Show inverse FVG PRO | true | bool | Flag gaps that price closed through and that now act from the other side. Off if you only want gaps that are still unfilled. |
4 · Liquidity 9 params
| Parameter | Default | Values | What it does |
|---|---|---|---|
| Show liquidity pools | true | bool | Equal highs and equal lows: the levels where stop orders pile up. |
| Equal-level tolerance (xATR) | 0.12 | 0.01..1 (step 0.01) | How close two highs must be to count as equal, as a multiple of ATR. Higher = groups more levels together. |
| Min touches | 3 | 2..6 | Highs or lows needed to call it a pool. 2 is permissive, 4+ only shows the obvious ones. |
| Max levels shown | 8 | 1..40 | Draw only the strongest N pools, so a busy market does not fill the chart. |
| Min level separation (xATR) | 0.4 | 0..3 (step 0.05) | Minimum gap between drawn liquidity levels, in ATR. Two lines closer than this are visually one, so only the stronger is kept. 0 disables it. |
| Hide swept pools | true | bool | Hide pools price has already run through. Off keeps them marked with a tick. |
| Show sweeps | true | bool | Mark the moment price runs a pool of stops and rejects - the stop hunt. |
| Max sweeps shown | 8 | 1..40 | Draw only the most recent N sweeps. |
| Sweep wick rejection | true | bool | Require the bar to close back inside the level. On = stricter, fewer and cleaner sweeps. |
5 · Order Blocks 6 params
| Parameter | Default | Values | What it does |
|---|---|---|---|
| Show order blocks | true | bool | The last opposite candle before a strong move: where the move was placed from. |
| OB displacement (xATR) | 1.2 | 0.3..5 (step 0.1) | How strong the move after the block must be, in ATR. This measures the NEXT bar's move, not the block itself. Higher = fewer, stronger blocks. |
| OB min body (xATR) | 0.0 | 0..3 (step 0.05) | Minimum body of the order block candle itself, in ATR. Filters out flat candles that only qualified because of what came after. 0 = off. |
| OB extend bars | 12 | 0..60 | How far to the right each block is drawn. It stops early if price returns to it. |
| Hide mitigated OB | false | bool | Hide blocks price has already returned to. Note: on H1 only a few percent of blocks are still untouched. |
| OB fill opacity (%) | 34 | 0..80 (step 2.0) | How solid the block boxes look. |
6 · Premium / Discount 4 params
| Parameter | Default | Values | What it does |
|---|---|---|---|
| Show premium/discount | true | bool | Split the current swing range in half: above equilibrium is expensive, below is cheap. |
| PD lookback (bars) | 75 | 20..400 (step 5.0) | How far back to look for the swing range that defines premium and discount. |
| PD band width (%) | 25 | 5..100 (step 5.0) | How much of the range, from each end, is shaded as premium and discount. 100 = the full bands. Lower keeps the chart readable and matches the idea: what matters is being at the EXTREMES, not at 51% of the range. |
| PD fill opacity (%) | 20 | 0..40 | How solid the premium and discount bands look. Keep it low - they are background. |
7 · Confluence 1 param
| Parameter | Default | Values | What it does |
|---|---|---|---|
| Show confluence score PRO | true | bool | A 0-100 reading of how many SMC conditions line up right now. It is context, never an entry trigger: it ranks how loaded the spot is, not when to act. |
8 · Multi-Timeframe 2 params
| Parameter | Default | Values | What it does |
|---|---|---|---|
| Show MTF structure PRO | false | bool | Overlay the structure bias of a higher timeframe. Note: measured on 8 symbols, aligning with the higher timeframe did NOT consistently improve the hit rate, so treat it as context. |
| MTF timeframe PRO | H1 | M30 · H1 · H4 · D1 | Which higher timeframe supplies that bias. |
9 · Style 6 params
| Parameter | Default | Values | What it does |
|---|---|---|---|
| Bullish colour (hex) | 1A9E8F | text | Colour of everything bullish. Accepts a name (green, teal) or a hex code. |
| Bearish colour (hex) | E53935 | text | Colour of everything bearish. Accepts a name (red, crimson) or a hex code. |
| CHoCH colour (hex) | E58E26 | text | Colour of change-of-character lines, kept apart from BOS on purpose. Name or hex. |
| MSS colour (hex) PRO | C77DFF | text | Colour of the market-structure-shift markers. Accepts a name (violet, gold) or a hex code. |
| Liquidity colour (hex) | D4AF37 | text | Colour of the equal-high and equal-low levels. Accepts a name (gold, red, dodgerblue) or a hex code. |
| Structure line width | 2 | 1..6 | Thickness of the BOS and CHoCH lines. |
10 · Alerts 12 params
| Parameter | Default | Values | What it does |
|---|---|---|---|
| Enable alerts | false | bool | Master switch. Alerts never fire in backtesting. |
| Popup | true | bool | Show a cTrader notification when structure breaks. |
| Sound | true | bool | Play a sound when structure breaks. |
| Email PRO | false | bool | Send alerts by email. Needs SMTP configured in cTrader (Settings - Advanced). |
| Email from PRO | (empty) | text | Sender address, as configured in cTrader. |
| Email to PRO | (empty) | text | Where the alert is sent. |
| Telegram PRO | false | bool | Send alerts to Telegram through your own bot. Best-effort: delivery is not guaranteed. |
| Telegram bot token PRO | (empty) | text | Token of your own Telegram bot, from @BotFather. |
| Telegram chat id PRO | (empty) | text | Id of the chat or channel the message goes to. |
| Alert: structure PRO | true | bool | Fire on BOS, CHoCH and MSS. |
| Alert: sweeps PRO | true | bool | Fire when a liquidity pool is swept. |
| Alert: order blocks PRO | false | bool | Fire when price taps an order block. Off by default: it is by far the noisiest of the three. |
11 · Reliability — the measurement layer 11 params
This whole group is what makes the indicator measure itself. Every rate is computed on your bars, and every threshold here is part of the definition of "it worked" — change them and the number changes, which is why they are exposed instead of baked in.
| Parameter | Default | Values | What it does |
|---|---|---|---|
| Load bars for stats | 3000 | 0..20000 (step 500.0) | Bars the indicator LOADS so it can measure. Without this the hit rate depends on how far back you happened to scroll - two people would see different numbers. It is also what fixes the need-more-history messages. 0 = use whatever is already loaded. |
| Max bars to load | 8000 | 500..50000 (step 1000.0) | Hard ceiling on the history loading above, so a symbol with very deep history cannot stall the chart while it measures. Raise it only if the panel still asks for more history. |
| Show reliability | true | bool | Measure how often price actually reacted at each element type, on your own chart. Shown in the info panel. |
| Reaction (xATR) | 1.0 | 0.2..5 (step 0.1) | How far price must travel away from the level to count as a reaction. Higher = a stricter definition of 'it worked'. |
| Invalidation (xATR) | 0.5 | 0.1..5 (step 0.1) | How far price must push through the level to count as a failure. Lower = a stricter test. |
| Measure last N bars | 0 | 0..20000 (step 100.0) | Bars to measure over. 0 = all loaded history. The hit rate is not stable through time - measured across 8 assets it moves 4 to 18 points between half-years, so a long average describes a mix of markets, not the current one. |
| Min sample | 20 | 5..500 (step 5.0) | Below this many resolved cases no percentage is shown at all. A 100% hit rate over 3 cases is noise that looks like data. |
| Compare FVG entry (edge vs 50%) PRO | true | bool | Measures both ways of entering a gap - at the near edge, or waiting for its 50% (consequent encroachment) - with the same stop, and shows both rates. Measured on 9 symbols the edge won in all of them, but your chart decides. |
| Show touch delay PRO | true | bool | How many bars an order block takes to be touched: percentiles 50 / 75 / 90. It answers when to give a level up - on H1 the median is 2-3 bars but the 90th runs past 70. |
| Auto-tune order blocks PRO | true | bool | Sweeps 12 displacement x body combinations and reports the best one for this symbol, next to the MEDIAN of the sweep. Both numbers matter: a best far above the median is variance, not an edge. It also shows how many of the 12 had enough sample to compete. |
| Hide OB below hit rate (%) PRO | 0 | 0..90 (step 5.0) | Stop drawing order blocks whose measured rate does not reach this. 0 = draw them all. Use it after reading Best setting here, not before. |
12 · Session clock 11 params
The windows below are read in each market's own clock by default, so the summer shift is applied for you — you set "London 8 to 14" once and it holds all year. Switch Session time mode to FixedOffset and they become plain UTC hours instead.
| Parameter | Default | Values | What it does |
|---|---|---|---|
| Session time mode | SessionTimeModeT.ExchangeTimezone | SessionTimeModeT | ExchangeTimezone reads the windows below in each market's own clock, so the summer shift is applied for you. FixedOffset treats them as plain UTC hours, which is what v2.0 did - correct in summer, one hour early all winter. |
| Asia timezone PRO | SessionZoneT.Tokyo | SessionZoneT | Clock used for the Asia window. Only matters in ExchangeTimezone mode. |
| London timezone PRO | SessionZoneT.London | SessionZoneT | Clock used for the London window. Only matters in ExchangeTimezone mode. |
| New York timezone PRO | SessionZoneT.NewYork | SessionZoneT | Clock used for the New York window. Only matters in ExchangeTimezone mode. |
| Session breakdown | true | bool | Split the order-block hit rate by London and New York hours. The Pro edition breaks it down across every session, with configurable windows. |
| Asia from PRO | 9 | 0..23 | Start of the Asia window. Read in the clock picked by Asia timezone (Tokyo has no daylight saving, so it never shifts). |
| Asia to PRO | 16 | 1..24 | End of the Asia window. |
| London from PRO | 8 | 0..23 | Start of the London window, in London time when Session time mode is ExchangeTimezone. The summer shift is applied for you. |
| London to PRO | 14 | 1..24 | End of the London window. |
| New York from PRO | 9 | 0..23 | Start of the New York window, in New York time when Session time mode is ExchangeTimezone. |
| New York to PRO | 17 | 1..24 | End of the New York window. In FixedOffset these are plain UTC hours and do NOT follow daylight saving. |
Reading the numbers it measures
Reading the numbers it measures
Every other SMC indicator draws zones and asks you to believe in them. This one counts, on your own bars and with your own thresholds, how often price actually reacted at the zones it drew - and prints the count next to the rate. Here is what each line means and what to do with it.
MEASURED ON THIS CHART
  Order blocks held         65%  (n=258)
  FVG held                  59%  (n=923)
  Sweeps reversed           36%  (n=570)
    OB - Asia               64%  (n=88)
    OB - London             67%  (n=67)
    OB - New York           66%  (n=82)
  FVG entry - edge vs 50%   59% vs 54%
  OB touched after          3 - 20 - 87 bars  (n=412)
  Best setting here         dspl 1.6 - body 0.5 -> 79% (median 66%) - 11/12 tested
  price reaction only - not a strategy result - overlapping zones are not independent
An example panel. The rate always ships with its sample size, and never without the line that says what it is not.
| Reading | Example | What it says | What to do with it |
|---|---|---|---|
| Order blocks held | 65% (n=258) | Of every order block drawn on this chart, the share where price reacted by Reaction (xATR) before invalidating by Invalidation (xATR). n is how many were counted. | Our baseline across 8 symbols on H1 is 63-69%. If yours sits far below that, the zones you are drawing have no measured reaction here - raise OB displacement or apply what Best setting here reports. |
| FVG held | 59% (n=923) | The same question for fair value gaps: did price react at the gap before invalidating. | Gaps are far more numerous than order blocks, so n climbs fast and the reading settles early. Use FVG min size (xATR) to stop counting noise. |
| Sweeps reversed | 36% (n=570) | After price swept a liquidity pool, how often it actually turned. | Measured at 38-44% across 3 symbols - fewer than half. A sweep on its own is not a reversal signal. Treat it as context and wait for structure to confirm. |
| OB - Asia / London / New York | 67% (n=67) | The order-block rate split by session, using the UTC windows you set. | There is no universal session rule. On USATECH we measured London 75% against Asia 50%; on XAUUSD the three sessions are flat. If one session breaks away on your symbol there is something to restrict - if none does, that is an answer too. |
| FVG entry - edge vs 50% | 59% vs 54% | Entering at the edge of a gap against waiting for its 50% (consequent encroachment), same stop, same gap - only the entry moves. | ICT teaching says wait for the 50%. We measured 9 symbols x 3 targets: 27 of 27 cells favour the edge, by 2.6 to 7.4 points, and the gap widens the further you aim. Your chart still decides - that is why both numbers are shown. |
| OB touched after | 3 - 20 - 87 bars | How long an order block takes to be touched: the 50th, 75th and 90th percentiles. | This answers a question no other indicator in the category answers: when do I give a level up? On H1 the median is 2-3 bars but the 90th percentile lands between 71 and 141. Deleting a level after ten candles throws away most of them. |
| Best setting here | dspl 1.6 - body 0.5 -> 79% (median 66%) - 11/12 tested | A 12-combination sweep of displacement x body filter, reporting the best and the median of the sweep, plus how many combinations had enough sample to compete. | The two numbers together are the point. Close to each other - the setting is real. Best far above the median - you are looking at variance, not an edge. And if x/12 is low the sweep barely compared anything: load more history. |
When it does not show a number
| Reading | Example | What it says | What to do with it |
|---|---|---|---|
| n/d | n/d | Not a single case has been counted yet. | Normal on a freshly opened chart. It resolves as history loads. |
| need 20+ (n=8) | need 20+ (n=8) | Cases exist but do not reach Min sample. | Nothing is broken - history is missing. Raise Load bars for stats, or move to a higher timeframe. On a short M15 chart all three sessions read like this. |
| only 4/12 tested | load more history | Most of the sweep could not compete: raising body shrinks the population, and thin charts leave those combinations under the minimum sample. | Do not trust Best setting here while this shows. With a long history the winner always carries body 0.3-0.5 at 71-82%; on a short one body 0.0 wins by elimination, not by merit. |
Situations, and what they call for
Everything reads need 20+ and you just installed it
That is history, not a fault. The indicator loads bars in the background until the measurement is complete; give it a few seconds and watch the panel settle. If it stays, raise Load bars for stats or step up a timeframe - lower timeframes need far more bars to fill three sessions.
Your order-block rate comes out low
Read Best setting here and apply its dspl and body to OB displacement and OB min body. That is exactly what the quality filter is for: across 3 symbols and 670 order blocks it moved the rate from 55% to 69%. Then use Hide OB below hit rate to stop drawing the rest.
The best setting is far above the median of the sweep
Distrust it. Picking the maximum of a sweep is selecting on noise - measured, the best of 12 beats its own median by 1.2 to 12.2 points on samples of 20-39 cases. That is why the median ships next to it. When the two nearly touch, the setting is worth using.
A sweep just fired and you want to fade it
The number says fewer than half of them turn. Use the sweep as context and let structure confirm - a CHoCH after the sweep is a different proposition from the sweep alone. The indicator draws both; it does not tell you to take either.
The rate is not what it was last month
Expected, and worth knowing: across 8 symbols and 5 half-year windows the same rate moved 4 to 18 points between halves. That is regime, not a bug. Measure last N bars exists precisely so you can ask about the recent market instead of the whole history.
What these numbers are not
- None of this is a strategy result. There are no entries, no stops, no costs and no position sizing. It counts how often price reacted at a zone on closed candles. If you read 63% as a win rate, the number will disappoint you - and it never claimed to be one.
- Overlapping zones are not independent. We measured 12-16% of order blocks overlapping another. That does not bias the rate, but it does inflate how confident
nlooks. - You define what "reacted" means.
Reaction (xATR)andInvalidation (xATR)are the whole definition; change them and the number changes. They are exposed on purpose rather than baked in behind a marketing figure. - It is measured on your chart, not promised from ours. Same symbol, same broker, same thresholds, your own bars. Every figure on this page is reproducible on your screen - which is the only reason we publish them.
Explore the other indicator
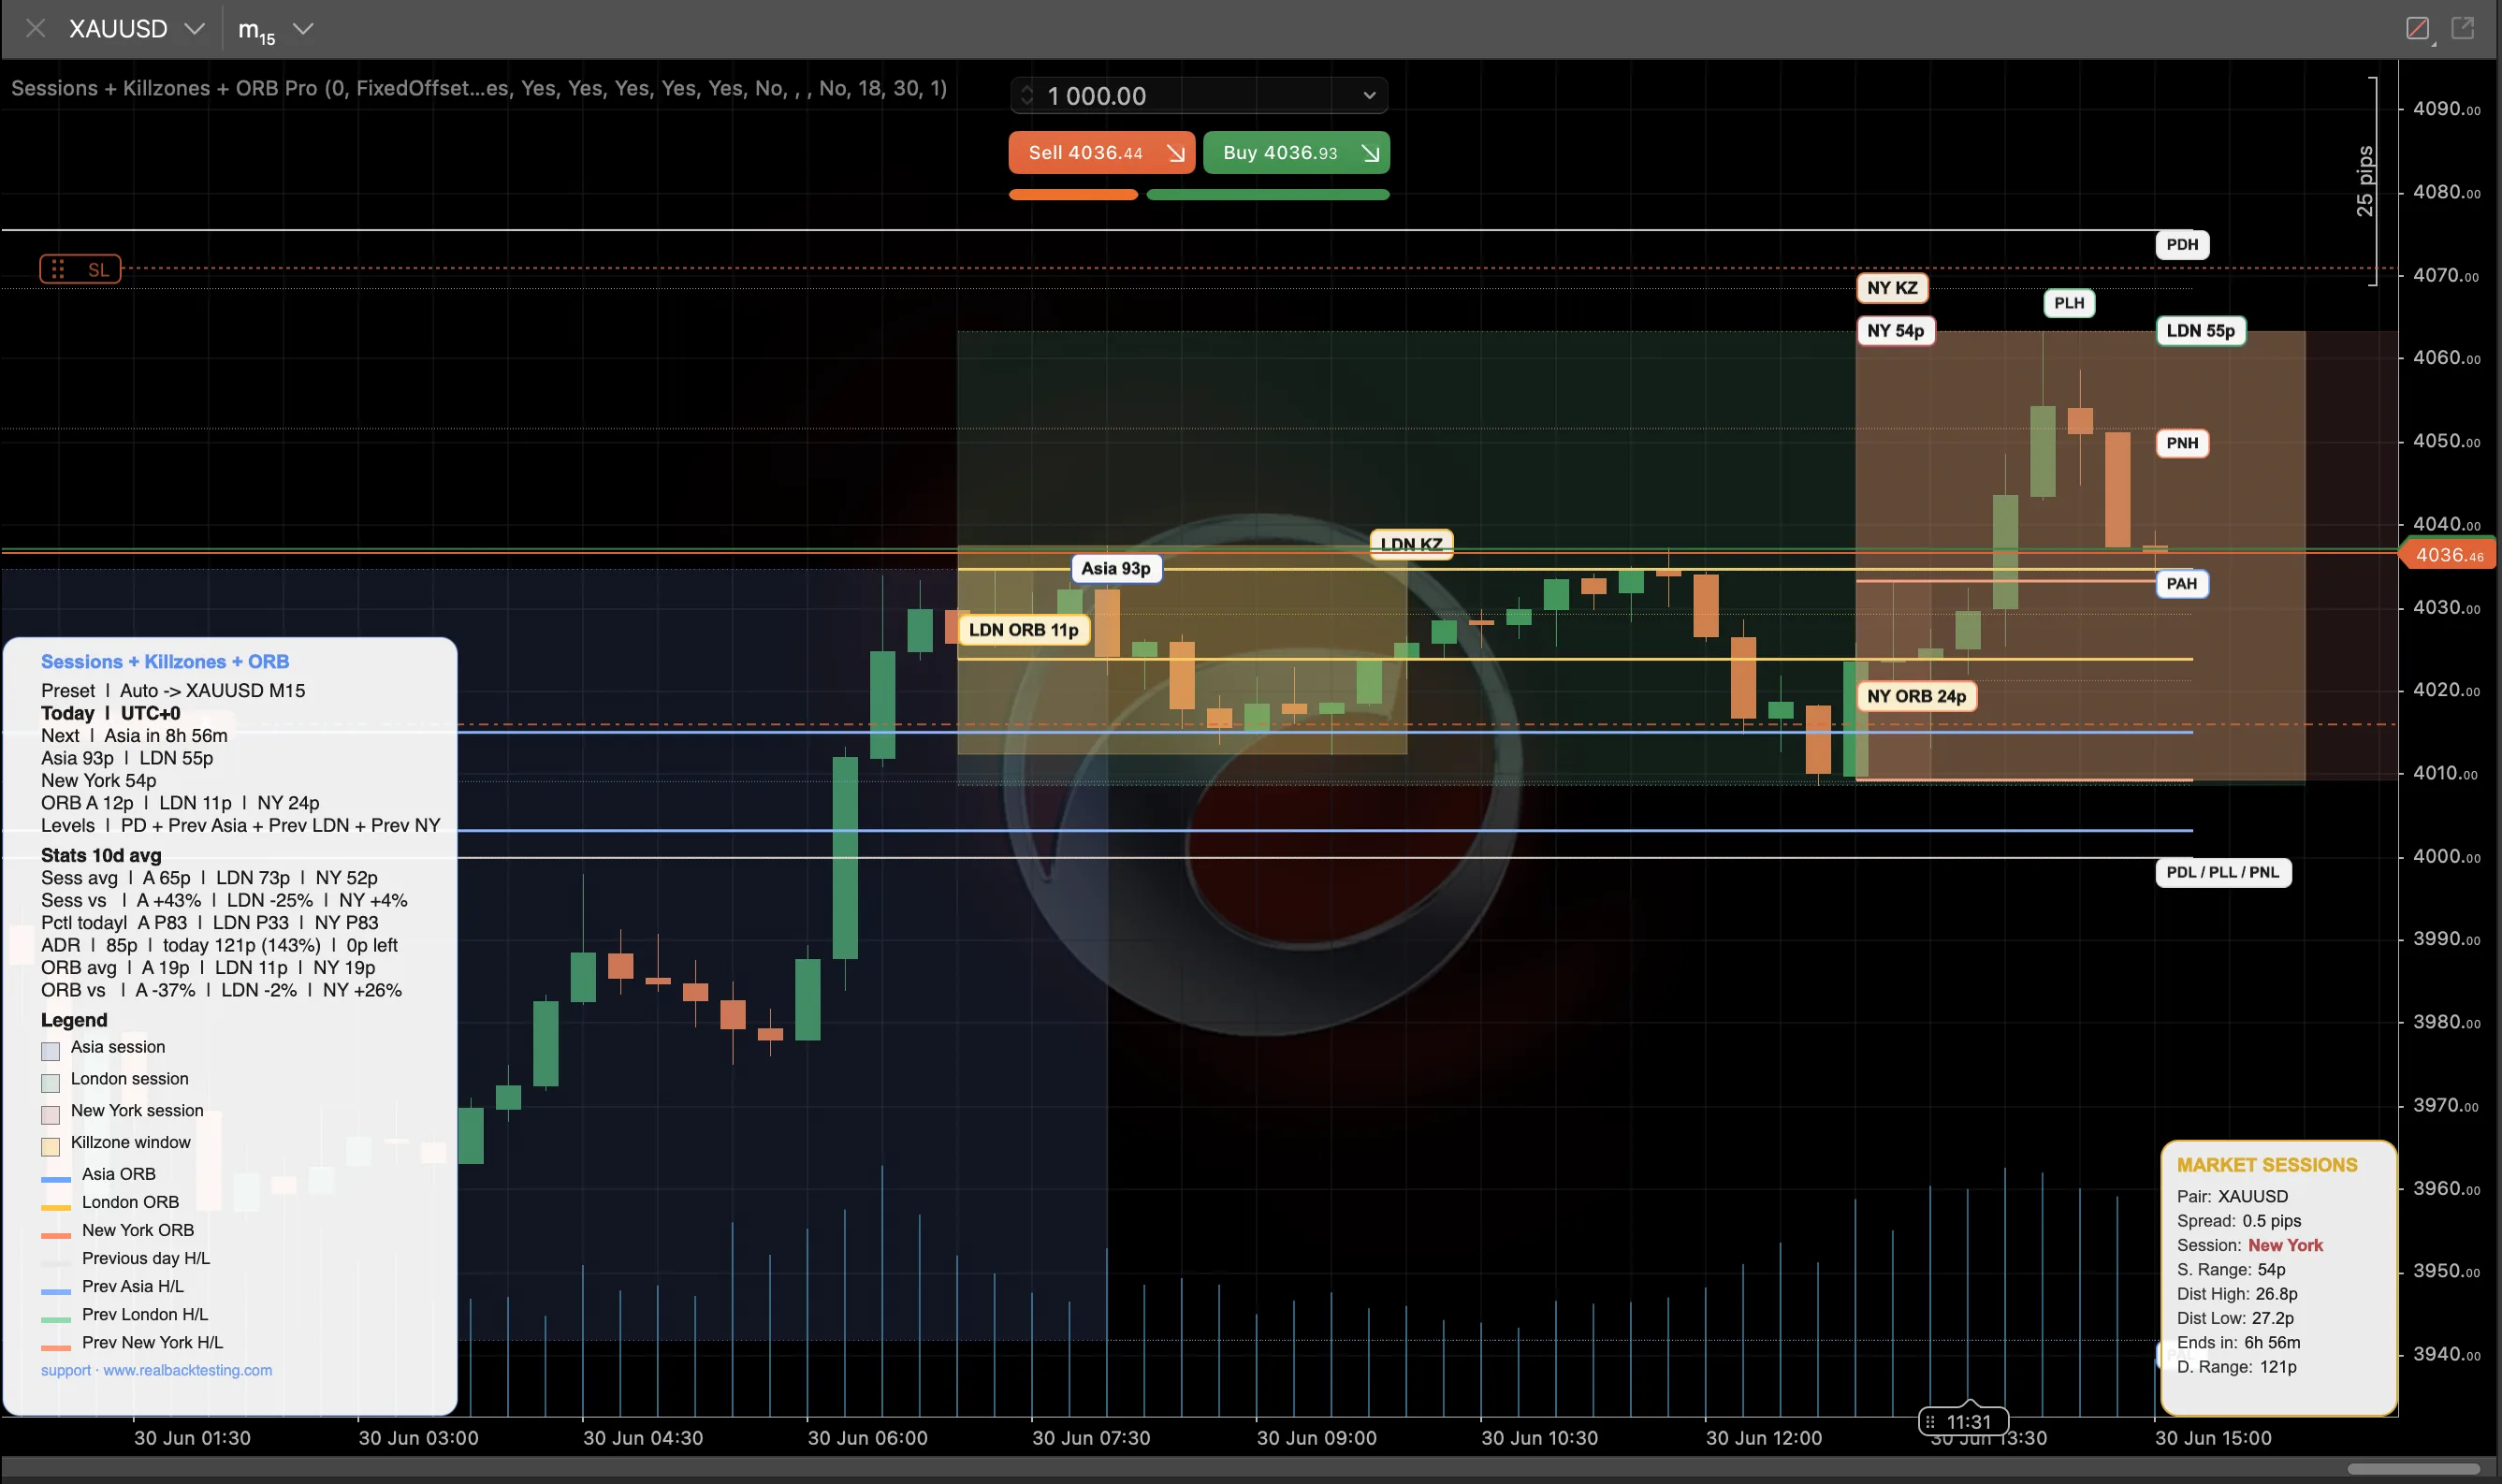 See screenshots ↗
Indicator · cTrader
Sessions + Killzones + ORB
Sessions, opening ranges and previous levels on your chart.
- Follow Asia, London and New York.
- Compare opening ranges and key levels.
Free · Pro from $29Explore ↗